The mismatch or the leverage paint used to hide the widening cracks
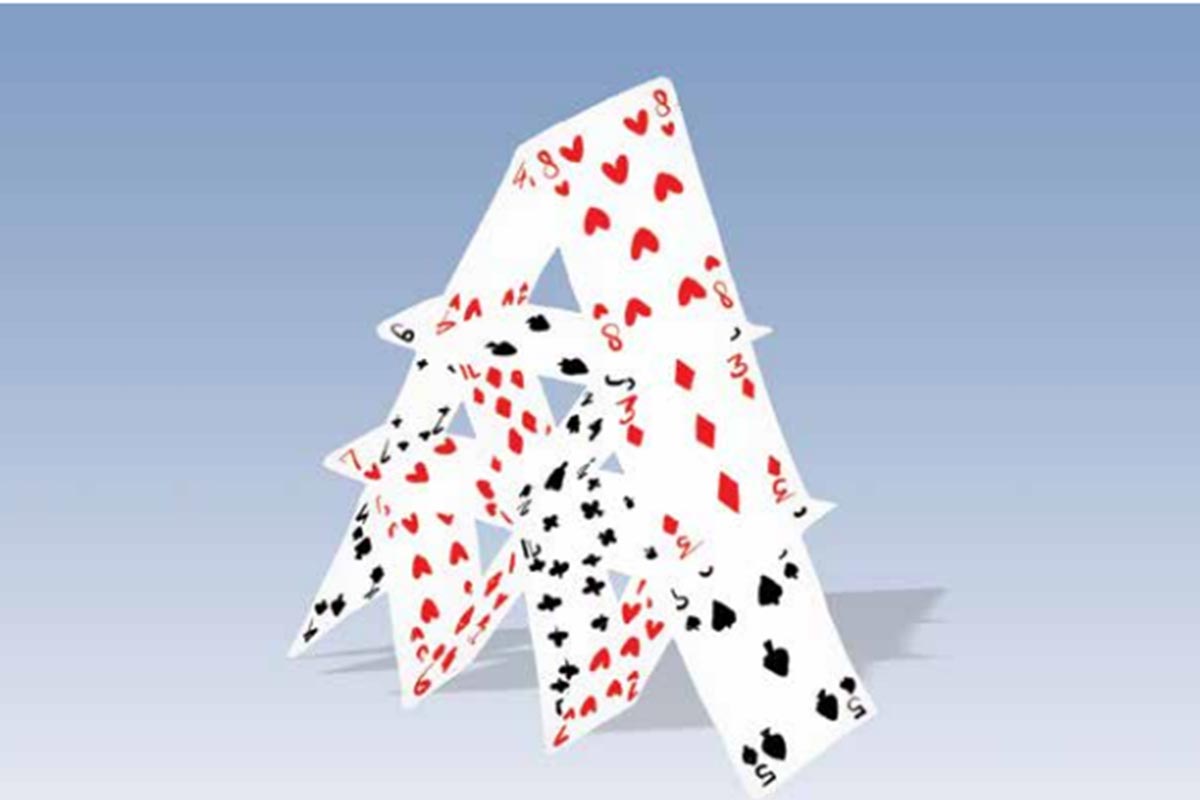
IN most cases, the problem generally lies with over-leverage, or creating a situation where the borrowings are more than funds invested by the owners. Usually, a leverage of up to 1:10 is manageable. But what happens if it reaches an astounding level of 1:20? By March 2014, the ratio of owners’ “own funds”, including through debentures and convertible preference shares, and borrowings was already unusually high at 1:14. By March 2018, it ballooned to 1:20. The combination of long-term and short-term loans almost doubled to Rs. 91,000 crore during the four-year period. There was a clear overheating and, given the promoters’ reluctance or their inability to understand the graveness of the situation, they allowed Ravi Parthasarathy to continue his borrowing spree to fund new, more ambitious projects, and use the new loans to repay the older ones. It’s a precarious situation for any company, especially ones that are in the business of financing and operating long-gestation infrastructure projects. A small, minor break-up in the chain can collapse the entire edifice, just like the Twin Towers fell under their own weights.
Borrowing short to fund long, or the curious case of unbalanced debt
INFRASTRUCTURE projects take a long time to fructify; there are inevitable delays due to various factors, like land acquisition and financial closures. Hence, it is prudent to borrow long, which is what Parthasarathy did until 2014. And then he changed track, and walked into the danger zone. Until March 2014, the over 200 direct and indirect subsidiaries, associate companies, and joint ventures, including foreign ones, had long-term borrowings that were almost eight times the short-term ones. The ratio dwindled to just four by March 2018. Clearly, the IL&FS businesses took on huge short-term loans to finance their long-term projects.
What was worse was the mix of the short-term debt. Inter-corporate deposits, i.e. a kind of hot money which has to be either paid or rotated on a regular basis, which were missing in 2013-14, zoomed to almost Rs. 2,000 crore in 2017-18. Short-term commercial papers almost tripled from Rs. 2,100 crore to Rs. 5,750 crore during the same four-year period. It was obvious that the businesses found it hard to borrow from the banks and institutions on a long-term basis, and had to resort to the more volatile money market to maintain its financial situation. Obviously, the group’s borrowing costs, or interest payments, went north – they doubled from just under Rs. 4,000 crore to just under Rs. 8,000 crore.
In its 2017-18 annual report, the management admitted that “growing non-performing assets” of the banks over the years had turned the mindset of the lending financial institutions “negative”. It was becoming harder to borrow ‘long’, which was reflected in delays of over three years in the financial closures in the case of three projects of a group company, ILFS Transportation Networks. Moreover, the company’s huge debt itself had reduced “credit availability” because the various lending banks had exhausted their “exposure limits”. As per prudent banking norms, there are limits to what the banks can lend to a single group.
The ‘Great Fall’ or the deliberate jump into a financial quicksand
WHEN the slide came, it showed in the accounts within a year. Until 2016-17, the group’s consolidated figures showed a positive profit after tax, but the figure came down from nearly Rs. 400 crore in 2013-14 to less than Rs. 300 crore. In 2017-18, the group PAT turned negative – it stopped at a huge loss of almost Rs. 2,400 crore. This was unprecedented. It was as if someone, possibly Parthasarathy, had a magic wand that he used to conjure profits year after year for almost three decades. When he left in July 2018, and the annual report was finalised in the next month, ILFS quaked as the enchanter, who could pull rabbits out of his financial hat at will, left.
Unfortunately, the rapid changes in the external environment aided the downfall of ILFS. One of them was related to the realm of policy-making. In the 2017-18 annual report, the management categorically said that there was a shift in the “project delivery” from BOT (Build, Operate and Transfer of the infrastructure project by the builder) to EPC (Engineering, Procurement and Construction) and HAM (a combination that entailed which was 40 percent EPC and 60 percent BOT). This “was also coupled with reducing the contract size to medium and small” from the earlier mega contracts under BOT for 10-30 years and more. Hence, there was an “increase in competition in a space not financially viable”. In a nutshell, Parthasarathy was unable to bag lucrative, one-sided contracts that favoured ILFS, and was forced to opt out of some projects.

There were also delays in implementation, which led to delays and cost overruns in several projects. One of the prime reasons for this was the change in the land acquisition Act. As the government forced higher payments for the purchase of land, the financial projections changed. More importantly, it “forced owners” who had sold earlier to seek higher compensation under the new Act. This caused delays, as well as higher costs, which necessitated re-discussion on existing contracts, or forced the builder to absorb the additional expenses. In addition, there were delays on the part of the concerned government authorities for requisite clearances, as not many officials wanted to take extra risks.
The ethereal component or the so-called ‘Intangibles’
IN the infrastructure sector, there are these vague, subtle and indefinable issues related to the assets that are constructed. These relate to the so-called ‘Intangible Assets’ and ‘Receivables from SCA (Service Concession Agreement)’. The intangibles include the commercial rights, i.e. the ability to charge for the use of assets such as roads, highways, tunnels, and others over the period of the “concession period” (10-30 years) granted by the requisite authority, leasehold rights “over the period of economic life” of a project, and goodwill acquired. Both shot up over the four-year period from 2014 to 2018. ‘Net Intangible Assets’ went up by over three times from Rs. 6,300 crore to Rs. 20,000 crore, and ‘Receivables from SCA’ six-and-a-half times from Rs. 1,300 crore to Rs. 8,500 crore. Of the former figures, the bulk during both the years comprised ‘Rights under SCA’ – these went up in sync from Rs. 6,100 crore to Rs. 18,650 crore.
In an ideal situation, there seemed to be nothing wrong with such increases. In BOT and HAM, the contractor could charge users, generally the public, for using the assets, like toll that one pays while travelling on a highway. The problem arises if the financial projections are skewed, and users’ charges are shown at a higher level. In some cases, the demand may be slack, either because the users are unwilling to pay the high charges, or the demand estimates themselves were wrongly calculated and inflated. One of the ILFS annual reports stated that the “right to charge users” was “not unconditional”, and depended solely on the “extent of usage” of a specific asset, like highway and expressway. If this didn’t happen, the contractor is in for huge trouble, as happened with the ILFS group.
Buying loyalty, or playing bridge with owners
PARTHASARATHY was a master of persuasion. He also knew how to please his promoters, financiers, managers, as well as contract-givers. He realised that there was nothing called a ‘free lunch’, and each section had to be goaded and attracted by sheer greed. Take the example of “Non-Convertible Redeemable Cumulative Preference Shares (NCRCPS)”, some of which were issued at hugely-attractive terms, and were categorised as “Minority Interest”, under the overall “Share Capital”. In 2014, these NCRCPS fell under two broad groups. One of them was the five million issued to ORIX Corporation of Japan, which owned 23 percent equity stake too, in July 2012 at 2 percent dividend per year, and redemption value at the face value of Rs. 10 each after 20 years. The other was over 700,000 issued in March-May 2014 at between 16 and 16.5 percent dividend per year, with redemption value of Rs. 7,500 face value plus Rs. 5,000 premium after seven years. A new category was added the next year (September-October 2015). Although the face value remained Rs. 7,500 and annual dividend at 16.5 percent for these 350,000 NCRCPS, the redemption value included Rs. 7,500, or 100 percent, premium in addition to the face value. Obviously, ILFS had to better the profits for its new investors.
As is now well-known, Parthasarathy paid himself a grand salary. In 2017-18, his salary was a grand Rs. 20.4 crore, which was higher than what Mukesh Ambani (Rs. 15 crore) paid himself. To be fair, however, it must be added that the former figure is skewed because it included Rs. 9 crore that formed a part of his “Retiral Fund”, and wasn’t part of the regular salary. Despite the deduction, the salary was high. So was the case of his two top managers, Hari Sankaran (Rs. 7.74 crore) and Arun K Saha (Rs. 7 crore). It was known in the infrastructure and finance circles that ILFS managers never left the group. In fact, they began working for the smallest subsidiary, and then found their way to bigger concerns, and ultimately to the parent company. No one, or not too many, quit the group. This was largely thanks to the high salaries and perquisites. A newspaper quoted a central finance ministry official saying that the CVs of ILFS managers were rarely found with the hiring agencies. They never shopped around.
The maze that Ravi created, or the underlying story of the subsidiaries, associates, and joint ventures
TO really understand what went wrong with the ILFS group, one has to delve deep into the 200-odd group companies, which included both Indian and foreign ventures. A bird’s eye view of these entities shows how Parthasarathy’s empire went down under within four years. In 2014-15, 105 earned profits, but 119 incurred losses. By 2017-18, the figures became skewed towards losses – 87 profitable ones, and 125 loss-making ones. The financial figures for 350 companies are not available. If the parent company, IL&FS, is taken out of the equations, the group’s PAT was a less than Rs. 100 crore in 2013-14, and combined losses almost Rs. 3,000 crore in 2017-18. Hence, the group’s profitability was always a question mark, given that its cumulative turnovers were Rs. 11,561 crore and Rs. 18,799 crore, respectively, in the two years, which gave it low net margins of around 3-4 percent even during the heydays.
A bird’s eye view of these entities shows how Parthasarathy’s empire went down under within four years. In 2014-15, 105 earned profits, but 119 incurred losses. By 2017-18, the figures became skewed towards losses – 87 profitable ones, and 125 loss-making ones. This in itself shows how the businesses quickly unravelled
A few profitable companies within the group in 2015 witnessed a sharp fall in earnings. These included ILFS Financial Services, ILFS Investment Managers, ILFS Transportation Networks, and Kiratpur Ner Chowk Expressway. Only the rare ones saw an explosion in profits – Barwa Adda Expressway, whose earnings jumped by almost three times. Many of the group entities turned from black to red – Rapid MetroRail Gurgaon South, Hyderabad Bareilly Expressway, Sikar Bikaner Highway, and Baleshwar Kharagpur Highway. In many instances, the losses intensified, like wat the case with Rapid MetroRail Gurgaon, MP Border Checkpost Development Corporation, ILFS Maritime Infra-structure Company, and ILFS Township and Urban Assets. However, the blunders were made in a series of new projects, especially in the energy sector. Several non-renewable deals, like ILFS Tamil Nadu Power Company incurred a huge loss in 2017-18. Others in the renewable segment, a host of wind energy entities, too were in the red. Rare were the successes between 2015 and 2018 – Fagne Sonagad Expressway and Srinagar Sonmarg Tunnelway.


